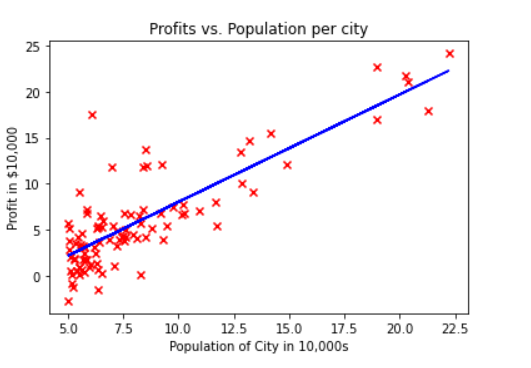
# Plot the linear fit
plt.plot(x_train, predicted, c = "b")
# Create a scatter plot of the data.
plt.scatter(x_train, y_train, marker='x', c='r')
# Set the title
plt.title("Profits vs. Population per city")
# Set the y-axis label
plt.ylabel('Profit in $10,000')
# Set the x-axis label
plt.xlabel('Population of City in 10,000s')
No comments:
Post a Comment